 MenkeScientific
Home | About Us | Contact Us |
| John's Page | Spectral Images Archive
Starllight Farm Observatory | Two Free Booklets
Spectral
Images Archive
Compiled by John Menke, Barnesville MD
The table below lists spectra I have taken and provides links to an image of the spectrum. Simply click on a link to see the graph for that object and date.
A few notes:
- Elsewhere on this website are descriptions of the equipment and methods I use. These may answer your questions. If not, ask for more information. Email or call – either method is OK but if you call, please note we are in the Eastern Time Zone.
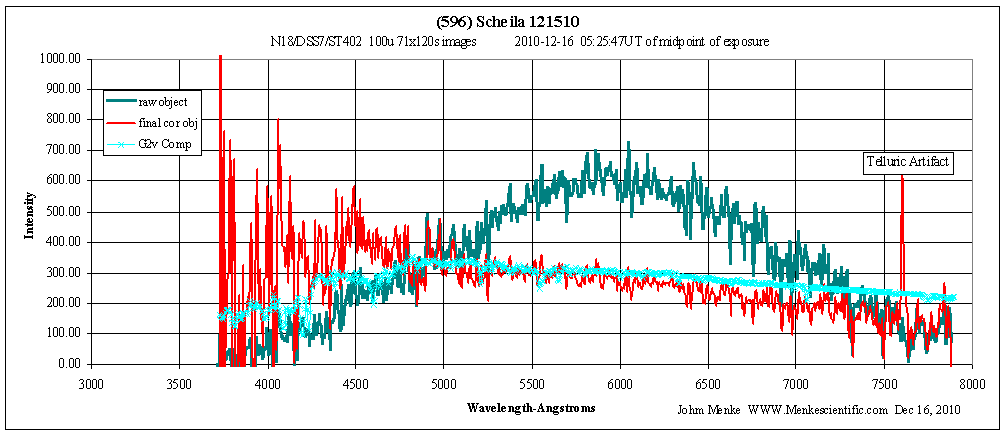
- Spectra taken in 2010 and later either have been or can be calibrated. Many graphs will show the original (raw) and corrected graphs of the object spectrum. The images of the raw spectra have been dark-corrected, rotated, combined (if more than one image), and sky background subtracted. The corrected graph has had instrumental and sky (Telluric line) corrections applied by deriving a correction curve from a spectrum taken of a nearby reference star and a corresponding library spectrum.
- Raw and corrected data, and original FITS files, are available for most observations.
- All data and software are available for public use. I request that you credit the origin and please let me know if you find it useful.
- The date in the table below is that of my initial observing
session. The date shown on the spectrum image may be different
because observations often cross into a new date.
|
Name of
object |
When observations began |
|
CICyg |
|
|
|
|
|
|
|
|
|
|
|
|
|
|
|
|
|
EGAnd |
|
|
ILAqr |
|
|
OQDel |
|
|
SSSyg |
|
|
UUCyg |
|
|
V603Cas |
|
|
V1285Aql |
|
|
V1285Aqr |
|
|
V1668Cyg |
|
|
WWCet |
|
|
ZAnd |
|
|
(596)Scheila
|
|
| SAG Nova |
April 27-28, 2012 |